← Home · BeTeam Research · Published 8 August 2026 · 9 min read
Do the scoring rules decide the winner? We re-scored 211,080 real predictions five ways
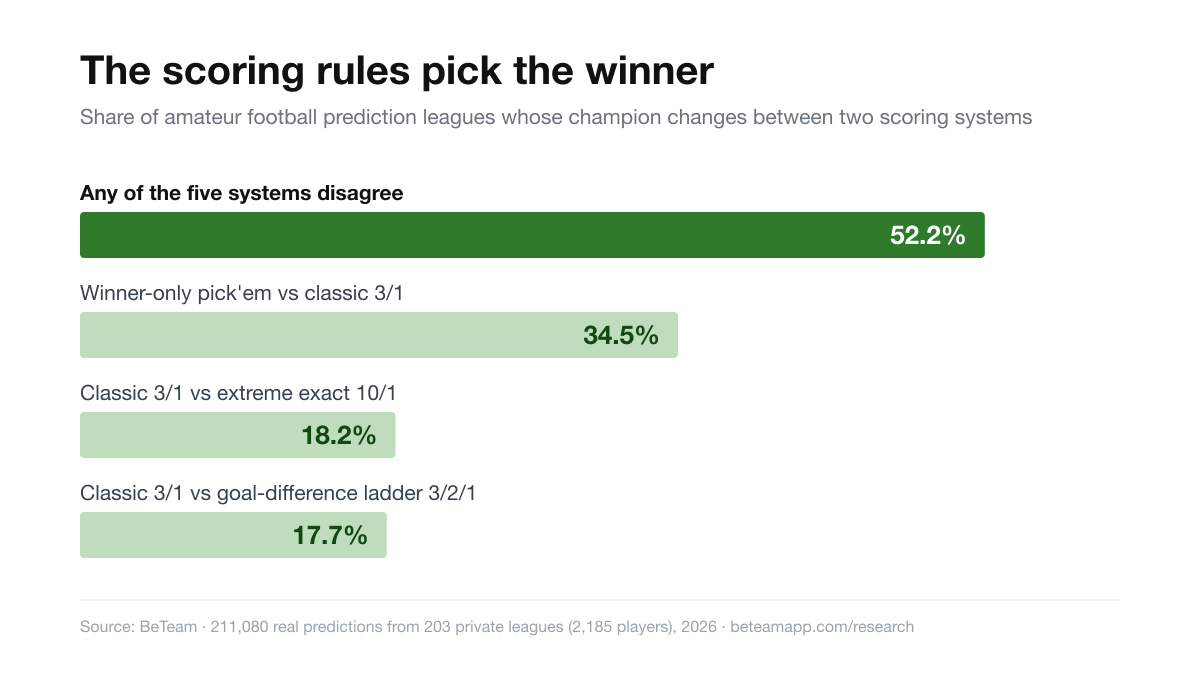
Every prediction league starts with an organizer picking a points system, usually in about ten seconds. BeTeam took 211,080 real football predictions and the final tables of 203 private leagues and re-scored all of them under five common systems. In 52.2% of those leagues, at least two systems crowned a different champion. The rules are not a formality — in half of all groups, they are the result.
Key findings
- The rules pick winners. In 52.2% of the 203 leagues studied, at least two of the five scoring systems produced a different champion.
- The biggest single swing is exact scores. Moving from winner-only picks to a 3-points-for-exact-score system changed the champion in 34.5% of leagues.
- Even small tweaks matter. Adding a goal-difference tier (3/2/1 instead of 3/1) changed the champion in 17.7% of leagues.
- Winner-only pools end in arbitrary ties. 12.3% of leagues finished with a tie for first place under winner-only scoring, versus 3.4% under systems that also reward exact scores or goal difference.
- Exact scores are rare enough to stay a bonus. Only 10.3% of predictions hit the exact score. At 3 points they supply 38.5% of all points; at 10 points they supply 67.6% — a lottery.
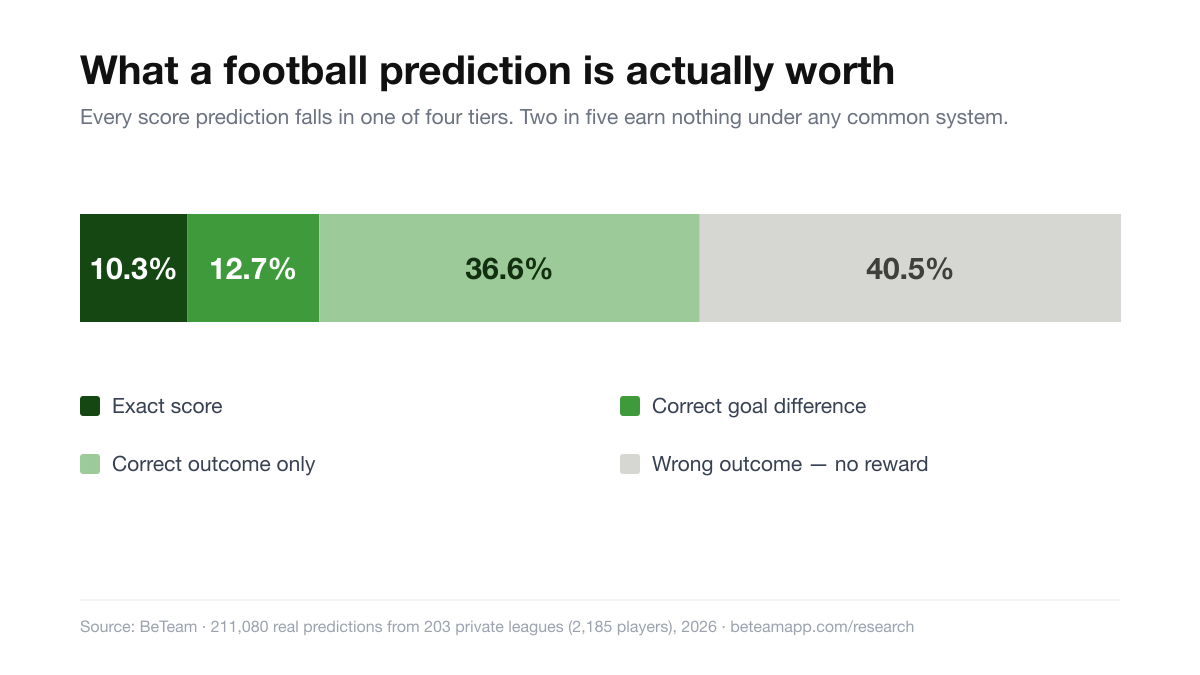
- Four in ten predictions score nothing under any of these systems, because 40.5% of predictions get the outcome wrong.
Why this question matters
A prediction league's scoring system is the only rule that touches every single result. Organizers pick one from memory or copy whatever their last group used, then treat the final table as a measure of football knowledge. This study tests that assumption directly: the same predictions, the same players, the same matches — only the points table changes. If the champion is stable across systems, the rules are cosmetic. They are not.
The five systems tested
BeTeam tested five points tables that cover the range organizers actually use, from the simplest office pick'em to an exact-score-obsessed variant. Each is described by what it awards for an exact score, a correct goal difference, and a correct outcome.
| System | Exact | Goal diff. | Outcome | Avg pts / prediction | Share of points from exact hits | Leagues tied for 1st |
|---|---|---|---|---|---|---|
| Winner-only (pick'em) | 1 | 1 | 1 | 0.60 | 17.3% | 12.3% |
| Classic 3/1 | 3 | 1 | 1 | 0.80 | 38.5% | 3.4% |
| Goal-difference ladder 3/2/1 | 3 | 2 | 1 | 0.93 | 33.3% | 3.4% |
| Wide ladder 4/3/2 | 4 | 3 | 2 | 1.53 | 27.0% | — |
| Extreme exact 10/1 | 10 | 1 | 1 | 1.52 | 67.6% | — |
Tie rates were measured for the three systems where the full league tables were recomputed with tie detection. "Share of points from exact hits" is the fraction of all points in the system that came from the 10.3% of predictions that hit the exact score.
How often the champion changes
This is the study's central result. For each of the 203 leagues, BeTeam recomputed every member's total under each system and compared who finished first. The champion is far from stable: more than half of all leagues have at least one pair of systems that disagree about who won.
| Comparison | Leagues with a different champion |
|---|---|
| Winner-only vs classic 3/1 | 34.5% |
| Classic 3/1 vs goal-difference ladder 3/2/1 | 17.7% |
| Classic 3/1 vs extreme exact 10/1 | 18.2% |
| Any of the five systems disagreeing | 52.2% |
Read the 34.5% figure carefully: in a third of all leagues, the person who picked the most winners is not the person who predicted scores best. Those are two different skills, and the points table decides which one your group is actually competing at.
What a prediction is actually worth
Every scoring system is really a way of pricing four outcomes. Across 211,080 real predictions the distribution is stable and, for organizers, slightly sobering: only one prediction in ten is perfect, and two in five earn nothing at all under any of these systems.
| Result tier | Share of all predictions |
|---|---|
| Exact score | 10.3% |
| Correct goal difference (not exact) | 12.7% |
| Correct outcome only | 36.6% |
| Wrong outcome — no reward | 40.5% |
That 12.7% band is the one most organizers forget. A group that scores only exact scores and outcomes throws away a real skill signal: predicting a 2-1 that finishes 3-2 shows you read the game, and the ladder systems are the only ones that pay for it.
The fair default, and when to break it
For most groups the fairest starting point is 3 points for the exact score, 2 for the goal difference, and 1 for the correct outcome. In this study that ladder produced the fewest arbitrary ties (3.4% of leagues), kept exact-score luck to a third of all points, and rewarded the widest range of near-misses. Two reasons to deviate, both legitimate:
- Very casual groups — a workplace where half the members will forget to predict — do better with winner-only picks, which are easier to explain and forgive. Accept that you will need a tie-break rule: one league in eight ends level at the top.
- Groups that want drama over fairness can raise the exact-score bonus, but should do it knowingly: at 10 points, two thirds of the final table is decided by the 10% of predictions that are hardest to repeat. That is a lottery with a leaderboard, and it is a perfectly good choice — as long as nobody claims it measures football knowledge.
Whatever you choose, choose it before matchday one and write it down. The one finding that applies to every group: the rules are part of the game, so changing them mid-season changes history.
Build your rules from this data
BeTeam's free prediction pool scoring calculator turns these findings into a rules document for your group: set your priorities and it recommends a points table, simulates ties and skill-versus-luck, and generates printable rules. The exact system BeTeam uses in the app is documented on the scoring rules page, and the companion study on how accurate fans actually are is in the fan prediction accuracy report.
Definitions
- Prediction — a member's forecast of a match's final score, submitted before kickoff and locked at kickoff.
- Exact score — both the home and away goal counts are correct.
- Goal difference tier — the predicted margin equals the actual margin, but the score is not exact (for example 2-1 predicted, 3-2 actual).
- Correct outcome — the predicted winner (or a draw) matches the result, regardless of the margin.
- Champion — the member with the highest total in a league at the end of the tournament, under a given scoring system.
- League — a private BeTeam group whose members predict the same competition.
Methodology
BeTeam analyzed 211,080 predictions from its production database, submitted by real users on matches that have finished and been settled. Auto-filled predictions (generated when a member misses a deadline) were excluded, because they represent no forecast. For each prediction, the three hit tiers were computed by comparing the predicted goals with the final score. Points were then recomputed under each of the five systems and totalled per member per league.
The league-level analysis covers the 203 leagues that had at least five members who each made at least ten predictions — the minimum for a final table to be meaningful. Those leagues contain 2,185 players. A "different champion" means the member ranked first under system A is a different person than the member ranked first under system B; where a system produced a tie at the top, the tie was broken deterministically for the comparison and counted separately in the tie-rate column. Average points per prediction for the 4/3/2 and 10/1 systems are computed arithmetically from the measured tier shares; all other figures are measured directly.
Reproducibility. Every figure is produced by a versioned, read-only SQL pipeline (three queries plus two derived averages) with eight automated cross-checks — tier shares summing to 100%, the any-pair disagreement rate being at least as large as every pairwise rate, winner-only ties exceeding granular-system ties, and others — all passing at publication. The pipeline, its SQL, and its outputs are committed in the BeTeam repository alongside the page.
Limitations
- One tournament dominates. 98.9% of the predictions come from the 2026 World Cup. Knockout tournaments have more one-sided fixtures than a domestic league season, which may make exact scores slightly easier and draws rarer than in, say, a Premier League season. BeTeam will repeat this study on 2026-27 club-season data.
- No multipliers. The five systems were tested in their pure form. Real pools often add doubled "super games", knockout escalation, or bonus questions; those amplify whichever tendency the base system already has.
- Champions, not full rankings. The headline measures who finished first. Mid-table order changes far more often still.
- Self-selected population. These are BeTeam users predicting in private leagues among friends, not a random sample of football fans.
Download the data
All three datasets are aggregate-only, contain no personal data, and are free to reuse with attribution (CC BY 4.0).
- Scoring systems compared (CSV) — points tables, average points per prediction, share of points from exact hits, tie rates.
- Champion changes between systems (CSV) — the pairwise and any-pair disagreement rates across 203 leagues.
- Prediction outcome distribution (CSV) — the share of predictions in each result tier.
How to cite this study
BeTeam (2026). Do the scoring rules decide the winner? 211,080 predictions re-scored under five systems. BeTeam Research, 8 August 2026. https://beteamapp.com/research/prediction-league-scoring-systems/
About this research
BeTeam is a free social prediction app where friends, families, and coworkers compete in private leagues — no real money and no gambling. This study was produced from BeTeam's own production data by the BeTeam team. Questions, corrections, or data requests: hello@beteamapp.com.
Revision history
- 9 August 2026 — added two charts of the published figures, reusable under CC BY 4.0. No figure changed.
- 8 August 2026 — first publication (211,080 predictions; 203 leagues; five systems).